Housing market • House prices
14 September 2026
Statistics Portugal (the Portuguese State's agency for the production and release of official statistics) has just published the results of the "House Prices Statistics at local level", the most comprehensive and detailed report on the evolution of prices in Portugal (I've added a brief methodological note at the end of the article so that you can draw your own conclusions).
With the data for the 1st quarter of 2024, it has been possible to aggregate the data shared by the National Statistics Institute over 6 years, since the 1st quarter of 2018. This gives us a prominent picture of the evolution of house prices nationwide, with particular detail in Lisbon and Porto and their respective metropolitan areas.
It is just as essential to take advantage of this statistics information as to understand the market and its context and determine which data should be prioritized and which could be questioned.
The aim is to give readers a better understanding of the dynamics of housing prices across the country and to remind them that diversity is very significant, even within the same region.

Aerial view of a beach in the Algarve
By Radu Bercan.
BEFORE THE NUMBERS, SOME CONTEXT
It is worth remembering that the strongest rise in house prices in Portugal began in what is commonly known as the “post-Troika” period, spreading initially from Lisbon’s historic center to the rest of the capital, and then to its metropolitan area. Almost at the same time — with a slight lag — a similar pattern emerged in Porto, spreading from the Baixa district to the rest of the city and neighboring municipalities.
Following the bailout request submitted by José Sócrates’s government, the Troika — the term commonly used to refer to the European Central Bank, the European Commission and the International Monetary Fund — was in Portugal from April 2011 to May 2014.
As this article covers the last eight years (Q1 2018–Q1 2026), a brief overview of the preceding years will help set the scene.
DEMAND
After the Troika’s departure, Portuguese banks began injecting money back into the economy, at a time when interest rates were at historic lows and would fall even further. This stimulated demand in two ways: greater incentives to borrow and less attractive savings and investment options elsewhere — in other words, more occasional investors entering the property market.
On May 17, 2014, the day marking the Troika’s official departure from Portugal, the six-month Euribor rate was below 0.5%. In November 2015, it turned negative and remained so until June 2022: more than six and a half years with this benchmark rate below zero.
To appreciate just how exceptional such a situation is — and the bizarre scenarios it can produce — at one point, some banks were charging institutional clients and large depositors to hold their deposits. In other words, instead of earning interest on the money they left in the bank, these clients were paying the bank to keep it there.
A new tenancy law had come into force in 2012, bringing fresh momentum to the market. By the end of 2014, more than 2,000 Golden Visas had been issued, and more than 2,000 people had joined the Non-Habitual Resident tax regime. In other words, Portugal was finally on the investment map.
As if that were not enough, those years also saw the country emerge as a leading tourist destination. And — something I feel rarely receives enough attention — a man from Madeira was becoming one of the biggest figures in global popular culture.
Since 1998, the year Lisbon hosted EXPO and José Saramago received the Nobel Prize in Literature, other figures, events and achievements in fields as diverse as politics and diplomacy, tourism and industry, sport, architecture and the visual arts have helped raise the country’s international profile.
But arguably no other individual or event has had an impact comparable to that of Cristiano Ronaldo, the most-followed person on both Facebook and Instagram worldwide.
Portugal’s international visibility grew considerably.
For someone to choose a country as a place to visit, invest or live, it is essential that they first know it exists or have the opportunity to learn as much as possible about it. I cannot be the only Portuguese person who, 20 or 30 years ago, found themselves explaining to someone from outside Europe that Portugal is a sovereign, independent country with almost nine centuries of history, or that its official language is not Spanish.
I suspect that, in 2026, such a conversation would be hard for almost any of us to imagine. Cristiano Ronaldo does not explain the rise in house prices in Portugal. But it is hard to believe that the country’s international profile — and, consequently, the international demand its residential property market attracted and the way that demand helped shape the supply of housing — would have developed in the same way without him.
SUPPLY
Construction almost came to a standstill.
Between 2010 and 2014, almost 40,000 construction and real estate companies went bankrupt. Some of the surviving companies focused on emerging markets, while the last sectors banks wanted to lend to were precisely those accounting for almost half of all overdue corporate loans: according to the June 2017 edition of Banco de Portugal’s Financial Stability Report, construction and real estate activities accounted for around 48% of overdue loans to non-financial corporations in 2016.
Another telling detail: in 2015, during the first round of higher education admissions, not a single student was placed in any of 10 Civil Engineering degree programs.
Graph 0 clearly illustrates the contrasts in housing production in Portugal over recent decades.

Graph 1 – Evolution in the number of dwellings completed in new construction for family housing in Portugal since the beginning of the 21st century.
Source: Pordata.
It is tempting to say that 565% more homes were built in 2000 than in 2020. Or that 18 times as many homes were built in 2002 as in 2015.
Not least because both statements are true.
This staggering contrast has understandably received considerable attention and prominence recently.
But we should not compare these figures solely through the lens of today’s difficulties.
The current context encourages us to see the strength of housing construction in Portugal at the turn of the century as an extraordinary achievement. But it is worth remembering something often overlooked: those figures were underpinned by levels of financial leverage and lending standards that today’s regulations would likely not allow.
That financing model was part of the excessive borrowing that preceded the 2008 financial crisis. The crisis, its effects on the banking system, and the subsequent sovereign debt crisis contributed, in turn, to what was described a few paragraphs earlier: the destruction of a significant part of the sector.
In other words, one reason we build less housing than we need today is that, in the recent past, we built more than was prudent to finance.
Even so, these figures do not capture all the homes coming onto the residential market each year. They do not include property rehabilitation, a segment of the sector that has played a significant role in Portugal over the past decade and a half: according to Statistics Portugal (INE), rehabilitation accounted for 22% of all completed construction works between 2018 and 2023, compared with 31% in the preceding five years.
LET US NOW EXPLORE HOUSE PRICES OVER THE LAST EIGHT YEARS...
The following sections present median prices per square meter for residential property transactions in each municipality of the Lisbon and Porto metropolitan areas and each parish within Portugal’s two largest cities, for each of the 33 quarters from Q1 2018 to Q1 2026.
These figures will be presented in four tables, covering the following periods:
Q1 2018–Q1 2020,
Q1 2020–Q1 2022,
Q1 2022–Q1 2024,
Q1 2024–Q1 2026.
In the tables, figures in red indicate decreases from the previous quarter, while figures in bold mark the highest values recorded in each municipality or parish over the entire period under review (Q1 2018 - Q1 2026).
Each set of four tables will be followed by a graph showing the change in prices over these eight years in the municipalities or parishes under review.
After examining the two metropolitan areas in detail, we will look at the municipalities of district capitals and regional government seats, followed by the “Top 20” most expensive municipalities in the country. Each analysis will include a graph showing median prices per square meter in the first quarter of 2026 and another showing how this indicator has changed since the first quarter of 2018.
MUNICIPALITIES IN THE LISBON METROPOLITAN AREA

Aerial view over Cascais Bay.
By Gustavo Frazão.
Q1 2018 – Q1 2020

Table 1.1 – Evolution of median value per sq. m. of residential property transactions by municipality in the Lisbon Metropolitan Area, between Q1 2018 and Q1 2020 (values in red represent price drops compared to the previous quarter).
Source: Statistics Portugal.
PRICE GROWTH ON THE CITY’S OUTSKIRTS
In the pre-pandemic period (Q1 2018 - Q1 2020), Lisbon still recorded very significant price growth: 29.1%. But Amadora led price growth in the Lisbon Metropolitan Area (LMA), with an increase of 47.0%.
Its proximity to Lisbon and, very likely, the extension of the Metro’s Blue Line into the heart of Amadora (Reboleira station opened in 2016) made the municipality an even more practical alternative for those who could no longer afford Lisbon’s prices but did not want to give up quick access to the capital’s center.
According to Google Maps, the 12-stop journey from Reboleira to Marquês de Pombal takes just 20 minutes, with no need to change lines.
Q1 2020 – Q1 2022

Table 1.2 – Evolution of median value per sq. m. of residential property transactions by municipality in the Lisbon Metropolitan Area, between Q1 2020 and Q1 2022 (values in red represent price drops compared to the previous quarter).
Source: Statistics Portugal.
WHERE DID HOUSE PRICE GROWTH ACCELERATE DURING THE PANDEMIC?
Between Q1 2020 and Q1 2022, a period that can and should be associated with the restrictions and disruptions caused by COVID-19, house price growth in the municipality of Lisbon slowed to 9.3% (compared with 29.1% in the previous period), with prices even falling in some quarters.
Over the same period, price growth in Amadora slowed to 20.5% (compared with 47.0% in the previous period). This slowdown affected 13 of the 18 municipalities in the Lisbon Metropolitan Area (LMA).
INE data show that the five municipalities where price growth between Q1 2020 and Q1 2022 exceeded that of the preceding two years — Alcochete, Palmela, Mafra, Vila Franca de Xira and Sesimbra — were also five of the six least densely populated municipalities in the LMA.
In 2022, both Alcochete and Palmela had 154 inhabitants per km². In Sesimbra, Mafra and Vila Franca de Xira, the corresponding figures were 279, 306 and 435 inhabitants/km², respectively.
To put this into perspective, population density in the municipalities of Lisbon, Amadora and Odivelas ranged from 5,500 to 7,500 inhabitants/km² that same year.
What does this pattern suggest?
That, during this period, house price growth accelerated in less densely populated parts of the LMA. This is consistent with an idea frequently expressed during the pandemic: more than ever, people were willing to trade a central location for more space.
A final note
Much was said about the resilience of house prices during the pandemic. But these discussions do not always take one thing into account: it is difficult to imagine that same resilience without government intervention and bank action. Remember the mortgage payment holidays, which allowed borrowers to pause their repayments temporarily? They played a key role not only in easing pressure on household budgets at a time when many families’ incomes had been affected by the sudden and unexpected downturn in economic activity, but also in easing fears and maintaining confidence.
It is also worth remembering that banks were not acting out of goodwill alone. Preventing a surge in loan arrears was also in their interest. And I believe that their experience of previous crises — the mortgage crisis and the sovereign debt crisis — left its mark on the culture of lending institutions, preparing them to respond more effectively to the challenges brought by the pandemic.
Payment holidays and similar measures were widely adopted worldwide, although their scope and conditions varied. And I cannot help but note that I do not remember hearing those who so frequently complain about government intervention criticize this kind of government initiative.
Q1 2022 – Q1 2024

Table 1.3 – Evolution of median value per sq. m. of residential property transactions by municipality in the Lisbon Metropolitan Area, between Q1 2022 and Q1 2024 (values in red represent price drops compared to the previous quarter).
Source: Statistics Portugal.
6 YEARS LATER, (MORE THAN) TWICE THE PRICE
Over the last two years, house price appreciation has continued but has lost some of its momentum. However, there is an inverse proportionality relationship between the value of houses in a given municipality and their appreciation rate.
In other words, the lower the house price in a given location (the municipalities at the bottom of the table), the greater the scope for it to rise. This is consistent with the idea that the crest of house price increases in Portugal began in the center of Lisbon (and then in Porto) and spread to its outskirts.
The values registered in Cascais are a surprise since, together with Lisbon, it forms the country's most expensive pair of municipalities, with a reasonably significant gap to the following municipalities. And yet (even with a decrease in pace since 2020), it manages – literally – to double its valuation in the space of 6 years.
On the other hand, there is reason to believe that this is one of those cases where the statistical solution found (the measure of central tendency, in this case, the median) may not be efficiently reproducing the evolution of house prices at every given moment.
I promise to return to Cascais and its valuation in the conclusions of this article to illustrate what was suggested in its introduction: that the results of statistical studies can be questioned.
Finally, looking at Graph 1 and price trends over the entire period under analysis (between Q1 2018 and Q1 2024), it should be noted that in 10 of the 18 LMA municipalities – Cascais, Almada, Amadora, Mafra, Sintra, Seixal, Setúbal, Barreiro, Palmela and Moita – house prices have risen by more than 100%.
In other words, they more than doubled.
On the other hand, when we take a closer look at Table 1.3, we see that the appreciation of houses in two-thirds of these municipalities is already below 10% per year. This could be good news for those wishing to buy a home in the country's largest metropolitan area.
Q1 2024 – Q1 2026

able 1.4 – Evolution of median value per sq. m. of residential property transactions by municipality in the Lisbon Metropolitan Area, between Q1 2024 and Q1 2026 (values in red represent price drops compared to the previous quarter, and the ones in bold register peaks in that municipality during the entire period under analysis).
Source: Statistics Portugal.
Q1 2018 – Q1 2024

Graph 2 – Evolution of median value per sq. m. of residential property transactions by municipality in the Lisbon Metropolitan Area, between Q1 2018 and Q1 2026 (the yellow bars represent increases of up to 100%, the orange ones represent increases of more than 100% and up to 200%, and the red represent increases of more than 200%).
Source: Statistics Portugal.
LISBON CITY PARISHES

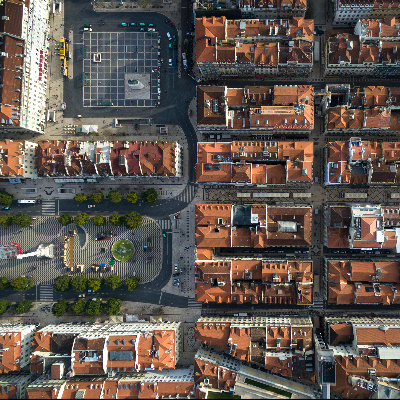
Aerial view of Marquês de Pombal Square, generally referred to as the most central point in Lisbon.
By Sebastio.
Q1 2018 – Q1 2020

Table 2.1 – Evolution of median value per sq. m. of residential property transactions by parish in Lisbon city center, between Q1 2018 and Q1 2020 (values in red represent price drops compared to the previous quarter).
Source: Statistics Portugal.
First, what is most obvious from looking at these tables is that we should be careful when we homogeneously talk about Lisbon. Its 24 parishes and 100 square kilometers represent a heterogeneous territory with different dynamics.
The period between the beginning of 2018 and the beginning of 2020 is still a time of significant house price appreciation in Lisbon.
The red quarters visible in Table 2.1 (which show a decrease compared to the immediately preceding period) are in a clear minority, and only in Carnide is the increase over these two years less than 20%, with 14 of the 24 parishes showing a variation of more than 30%.
Q1 2020 – Q1 2022

Table 2.2 – Evolution of median value per sq. m. of residential property transactions by parish in Lisbon city center, between Q1 2020 and Q1 2022 (values in red represent price drops compared to the previous quarter).
Source: Statistics Portugal.
THE PANDEMIC, MOBILITY, RENTING AND LOCAL ACCOMMODATION
Table 2.2 shows that, in general, the pandemic period has significantly penalized the evolution of prices in the capital. This is partly due to the difficulty or inability that residents in other countries sometimes face in arriving or settling in Portugal.
It's important to remember that, unlike what is often suggested, the effect of pressure from foreign citizens on house prices is not strictly through the purchase of a property. Suppose this demand affects rents in the city. In that case, it will also impact the market value of a house, which is ultimately expressed as a multiple of the rents that the property can generate.
On the other hand, you may not remember, but during the state of emergency declared during the pandemic, the government made it impossible to cancel rental contracts for non-payment of rent. In other words, regardless of whether we agree or disagree with the measure (and we should remember that the context was probably the most atypical of our lives), the truth is that political action left landlords at the mercy of tenants.
What is the point of consulting the official data on new rents at the time (and in Q1 2021, Lisbon and Porto registered year-on-year drops in rents) when we know that in that period, there were landlords who agreed to lower rents and others who stopped receiving them?
We must remember the contribution of this context when we look at Table 2.2 and see the values in red, indicating price drops compared to previous quarters
Another piece of evidence is that prices in the parishes of Misericórdia and Santa Maria Maior fell during the pandemic (and that in some other parishes, the value increases were marginal). There is also a double effect here. These two parishes geographically encompass some of the most touristic areas of the cities. So it's normal that the short and medium-term rentals that proliferate there have fallen in number and value, penalizing the expected income those properties could generate.
At that time, there was no shortage of apartments on Idealista (Portugal's largest real estate portal), in central areas of the city, advertised at attractive prices for periods of less than a year in the hope that the following summer, the evolution of the pandemic would once again allow for high yields in short-term formats.
On top of this are two parishes that comprise neighborhoods where restrictions on short-term rental/Alojamento Local (AL) were imposed from the outset: the so-called "containment zones".
What happened in these areas?
- New license applications for AL units are no longer accepted;
- The sale of a property with a valid license implies its expiry, making it impossible to replicate the previous activity and its profitability, penalizing the commercial value of the property.
The first two containment zones were implemented in November 2018 and affected both parishes. But, a year later these restrictions were extended and left practically the entire parish of Santa Maria Maior excluded from new AL licenses. That said, according to the Lisbon City Council (CML) and the latest 2021 Census, in Santa Maria Maior and Misericórdia the ratio of properties dedicated to LA to "Classic Family Housing" was 71.3% and 47.4%.
In other words, in each of these parishes, for every 10 dwellings where someone is expected to live permanently, there were another 7 and 5 dwellings, respectively, dedicated to AL. These are very significant figures which seem to justify the need for CML to apply geographical restrictions to new AL licenses.
But this also means that a very significant proportion of the apartments in those two parishes will lose their ability to generate income the moment they are sold (due to the extinction of the AL license and the impossibility of replicating the current business model). This also means that the price at which it will be sold will necessarily be lower than the price someone would be willing to pay for those properties if there were no restrictions on their operation.
Q1 2022 – Q1 2024

Table 2.3 – Evolution of median value per sq. m. of residential property transactions by parish in Lisbon city center, between Q1 2022 and Q1 2024 (values in red represent price drops compared to the previous quarter, and the ones in bold register peaks in that parish during the entire period under analysis).
Source: Statistics Portugal.
AND NOW?
If you look at the behavior of housing prices over the last two years, you can see that properties in Lisbon are recovering their pace of appreciation. The figures registered between Q1 2022 and Q1 2024 do not suggest the stabilization of housing values that so many potential buyers seem to be looking forward to.
In other words, the most detailed and robust statistics on housing prices in Portugal suggest that, in general (and this disclaimer is essential), dwellings in Lisbon continue to appreciate. And, if the mathematical results are to be believed, they will have always appreciated above inflation during this period. Even if, in the conclusions of this article, it will be questioned whether it is reasonable to conclude that the methodology of this study allows us to take these particular data for granted.
As for the fact that in less than six years prices in Marvila have risen by more than 300%, and that this once forgotten parish has gone from the cheapest to the second most expensive in Lisbon, I refer you to this text from June 2022, which explained what “Marvila has that no other place in Lisbon can offer”.

Graph 3 - Number of new beneficiaries of the Non-Habitual Resident status by year.
Source: Court of Auditors (based on data provided by the Portuguese Tax Authority).
Q1 2024 – Q1 2026

Table 2.4 – Evolution of median value per sq. m. of residential property transactions by parish in Lisbon city center, between Q1 2024 and Q1 2026 (values in red represent price drops compared to the previous quarter, and the ones in bold register peaks in that parish during the entire period under analysis).
Source: Statistics Portugal.
Q1 2018 – Q1 2024

Graph 2 – Evolution of median value per sq. m. of residential property transactions by parish in Lisbon city center, between Q1 2018 and Q1 2024 (the blue bars represent increases of up to 50%, the yellow bars represent increases of more than 50% and up to 100%, the orange bars represent increases of more than 100% and up to 150%, and the red bars represent increases of more than 150%.)
Source: Statistics Portugal.
MUNICIPALITIES IN THE PORTO METROPOLITAN AREA

Aerial view of the “She Changes” installation, better known as “Anémona,” near Matosinhos Beach.
By Pedro Menezes.
Q1 2018 – Q1 2020

Table 3.1 – Evolution of median value per sq. m. of residential property transactions by municipality in the Porto Metropolitan Area, between Q1 2018 and Q1 2020 (values in red represent price drops compared to the previous quarter).
Source: Statistics Portugal.
Remember what was written at the beginning? That the most significant increase in the value of houses in Portugal was initially felt from the historic center of Lisbon to almost the entire capital area?
And, with only a slight delay, from downtown Porto to the rest of the city?
This is precisely what can be seen when comparing the results obtained between the first quarter of 2018 and the first quarter of 2020 in the parishes of Lisbon and Porto and the municipalities of their respective metropolitan areas.
In this period, valuation was already more robust in the capital's metropolitan area than in the city center. But to the north, the parishes of the city of Porto were still appreciating at a higher rate than the neighboring municipalities.
Q1 2020 – Q1 2022

Table 3.2 – Evolution of median value per sq. m. of residential property transactions by municipality in the Porto Metropolitan Area, between Q1 2020 and Q1 2022 (values in red represent price drops compared to the previous quarter).
Source: Statistics Portugal.
What struck me most during this period was the fact that appreciation in Porto and Matosinhos fell by more than 10% compared to the previous 2 years (from 35.8% and 36.9%, respectively, to 24.5%).
These are the most expensive municipalities in the metropolitan area. However, they are also the most densely populated and, therefore, at least in theory, the most vulnerable to the impact of a pandemic.
On the other hand, which municipality has seen the most significant increase in value during the pandemic period? Arouca, with 33.6%. Coincidently (or not), it is one of only two municipalities (along with Espinho) where the growth in value in the previous period was less than 10%.
Arouca has, by far, the lowest population density in the entire metropolitan area (according to Pordata, an estimate of only 64 inhabitants per square meter in 2023). That's why, although not as obviously as in the Lisbon Metropolitan Area (where there are municipalities with a higher population density), there also seem to have been those further north willing to trade centrality for space.
During this period, the wave of residential real estate appreciation in the Porto Metropolitan Area (PMA) began to follow what was to be expected: growth from the center to the outskirts.
Q1 2022 – Q1 2024

Table 3.3 – Evolution of median value per sq. m. of residential property transactions by municipality in the Porto Metropolitan Area, between Q1 2022 and Q1 2024 (values in red represent price drops compared to the previous quarter).
Source: Statistics Portugal.
In 14 of the 17 PMA municipalities, prices rose by more than 20% between the first quarters of 2022 and 2024. Something that, for example, only happened in 6 of the 18 AML municipalities.
This sharper growth in prices in the north is essentially due to the aforementioned slight delay that Porto is experiencing compared to Lisbon at the start of this “post-troika” boom. Not forgetting that what we call a delay in the light of a chronological analysis can mean greater scope for valuation in an investment diagnosis.
CONCENTRATION OF THE HIGHEST VALUATIONS AROUND THE CITY OF PORTO
Graph 3 shows that, contrary to what happens in the Lisbon region (where prices tend to vary more in outlying municipalities), the biggest increases in value occurred precisely in 2 of the 4 municipalities adjacent to Porto: Matosinhos and Vila Nova de Gaia.
It should be added that, in general, in the municipalities where prices are lowest, the increase in value has not been particularly significant in recent quarters. Arouca, the least dense municipality and the one that had appreciated the most during the pandemic, has appreciated the least in the last two years.
These data suggest that, as house prices and real estate investment have expanded from the center of Portugal's two largest cities to their outskirts, it should be noted that in the north (even discounting priorly mentioned delay), the strength of this ripple effect seems to be more limited in space.
Graph 3 illustrates this. Of the 5 municipalities in the PMA (out of a total of 17) whose housing values have more than doubled, 3 of them are precisely the most expensive: Porto, Matosinhos and Vila Nova de Gaia.
Q1 2024 – Q1 2026

Table 3.4 – Evolution of median value per sq. m. of residential property transactions by municipality in the Porto Metropolitan Area, between Q1 2024 and Q1 2026 (values in red represent price drops compared to the previous quarter, and the ones in bold register peaks in that municipality during the entire period under analysis).
Source: Statistics Portugal.
Q1 2018 – Q1 2024

Graph % – Evolution of median value per sq. m. of residential property transactions by municipality in the Porto Metropolitan Area, between Q1 2018 and Q1 2026 the blue bars represent increases of up to 100%, the yellow ones represent increases of more than 100% and up to 150%, the orange ones represent increases of more than 150% and up to 200%, and the red ones represent increases of more than 200%).
Source: Statistics Portugal.
PORTO CITY PARISHES

Largo dos Lóios, Porto's historical city center.
By Rh2010.
Q1 2018 – Q1 2020

Table 4.1 – Evolution of median value per sq. m. of residential property transactions by parish in Porto city center, between Q1 2018 and Q1 2020 (values in red represent price drops compared to the previous quarter, and the ones in bold register peaks in that municipality during the entire period under analysis).
Source: Statistics Portugal.
In this period, it is possible to confirm a reasonably robust evolution of housing prices in Porto. It is assumed that the increase in value in the União das Freguesias de Cedofeita Santo Ildefonso Sé Miragaia São Nicolau e Vitória, the city's historical area, which includes "Baixa" and "Ribeira" areas, may have been even more pronounced in previous years. In any case, this more significant price variation is beginning to be felt clearly in its 4 neighboring parishes: União das Freguesias de Lordelo do Ouro e Massarelos, Ramalde, Paranhos, Bonfim.
This price rise in historic areas and their surroundings demonstrates that urban rehabilitation has played a crucial role in the existing buildings (Porto's downtown was just as decadent as its Lisbon equivalent) and in rebuilding the social fabric. In other words, there has been a significant gentrification of the area. Some will call it a renewal of the resident population; others will call it segregation.
It should be noted that the União das Freguesias de Aldoar Foz do Douro e Nevogilde, where part of the famous Avenida da Boavista is located and, as the name suggests, the Foz area, is the most expensive region in the city but the one that has seen the least abrupt, albeit quite significant, increase in value.
Q1 2020 – Q1 2022

Table 4.2 – Evolution of median value per sq. m. of residential property transactions by parish in Porto city center, between Q1 2020 and Q1 2022 (values in red represent price drops compared to the previous quarter).
Source: Statistics Portugal.
What is usually regarded as the pandemic period hasn't affected Porto the same way as it did the capital.
Although the appreciation of houses in the union of parishes that includes the historic area has fallen by more than 10%, this has to be attributed in large part to the lockdowns and all the restrictions that have greatly affected tourism.
On the other hand, the appreciation curve in Porto was still very vibrant. During this period, only Bonfim appreciated by less than 20% (10.9%). However, this figure must be put into context with the impressive 72.5% increase in value recorded in this same parish over the previous two years.
Q1 2022 – Q1 2024

Table 4.3 – Evolution of median value per sq. m. of residential property transactions by parish in Porto city center, between Q1 2022 and Q1 2024 (values in red represent price drops compared to the previous quarter).
Source: Statistics Portugal.
Table 4.3 demonstrates how Porto's idea of delay compared to Lisbon also offers an inversely proportional insight: that there is more (temporal) space for the appreciation of residential assets in the "undefeated city" (Porto holds this nickname because, after its reconquest in the 9th century, it was never conquered again by other forces).
BUT BACK TO URBAN REHABILITATION...
As prices in the historic area grew, interest in the neighborhoods to the east (opposite to the mouth of the River Douro) increased.
The saturation of the historic area has generated one of the most visible cascade effects of the last six years. One outcome is the emergence of the parishes of Bonfim and Campanhã as part of the group of preferred targets for real estate investment and urban rehabilitation in the city.
After all, how many corners around Passeio de São Lázaro or Campo 24 de Agosto, consensually described as decadent about 10 years ago, have now become regular features in the best-known lifestyle magazines?
And if you keep walking in the same direction, what will you find?
Campanhã Train/Bus Station. The location that offers, for instances, a direct link to Faro, the furthest of all the country's district capitals. Around it, an ambitious urbanization plan has already been presented that aims to turn that point of the city into a new centrality.
And what does Graph 4 do other than demonstrate that this is precisely what is happening?
In the parishes of Bonfim and Campanhã, house prices grew by 145% and 207%. To be clear, this means that - in 6 years - the variation in the sale value of residential properties in Bonfim has increased almost 2.5 times. And that, in Campanhã, their median value has more than tripled.
But does it make sense to say that house prices have tripled?
It may have. But please note that we are not necessarily saying that the same property, with no significant changes in its state of repair, has tripled in price in 6 years. Once again, we invite you to read the article's conclusions for a more detailed answer to this question.
Q1 2024 – Q1 2026

Table 4.4 – Evolution of median value per sq. m. of residential property transactions by parish in Porto city center, between Q1 2024 and Q1 2026 (values in red represent price drops compared to the previous quarter, and the ones in bold register peaks in that parish during the entire period under analysis).
Source: Statistics Portugal.
Q1 2018 – Q1 2026

Graph 6 – Evolution of median value per sq. m. of residential property transactions by parish in Porto city center, between Q1 2018 and Q1 2026 (the yellow bars represent increases of up to 150%, the orange ones represent increases of more than 150% and up to 200%, and the red ones represent increases of more than 200%).
Source: Statistics Portugal.
MUNICIPALITIES OF DISTRICT CAPITALS
AND REGIONAL GOVERNMENT SEATS

Leiria Castle, seen from Rodrigues Lobo Square.
By Diogo Palhais.

Graph 7 - Median prices per square meter of residential properties sold in the municipalities of district capitals and regional government seats in the first quarter of 2026 [red columns represent median prices above €4,000/sq. m, orange columns represent median prices above €3,000/sq. m and up to €4,000/sq. m, yellow columns represent median prices above €2,000/sq. m and up to €3,000/sq. m, and blue columns represent median prices up to €2,000/sq. m].
Source: Statistics Portugal.

Graph 8 - Evolution of median value per sq. m. of residential property transactions in municipalities of district capitals and regional government seats between Q1 2018 and Q1 2026 (the blue bars represent increases of up to 100%, the yellow bars represent increases of more than 100% and up to 150%, the orange bars represent increases of more than 150% and up to 200%, and the red bars represent increases of more than 200%).
Source: Statistics Portugal.
TOP 30
Do you know which are the only regions that, according to the 2021 Census, have seen population growth in the last 10 years? Lisbon Metropolitan Area (LMA) and the Algarve.
And that, of the 30 municipalities where the cost of housing is highest, 13 are in the LMA and 11 in the Algarve?
The list is completed with Porto and Matosinhos in the Porto Metropolitan Area (PMA), Grândola and Sines in the Alentejo (which counteract the sharpest regional decline in the whole country), and Funchal and Nazaré.

Aerial cityscape of Ferragudo (Lagoa municipality) by Arade River, in Algarve
By malajscy.

Graph 9 - Median prices per square meter (€/sq. m) in the 20 municipalities with the highest prices in Portugal in the first quarter of 2026 [red columns correspond to values above €5,000/sq. m, orange columns to values above €4,000/sq. m and up to €5,000/sq. m, and yellow columns to values above €3,000/sq. m and up to €4,000/sq. m].
Source: Statistics Portugal.
I have shared data such as that shown in Graph 6 with people who continue to claim that foreign demand does not significantly impact house prices in Portugal.
And I wonder if the fact that 6 out of the 10 municipalities where it costs the most to buy a house are located in the Algarve – the first destination in mainland Portugal to be mentioned when it comes to tourism – isn't an indicator you should consider.
It's not a question of demonizing foreign demand (in fact, people in my profession – real estate agents – primarily benefit from it) but to try to recognize the real causes of the phenomena. Failure to do so could mean attributing to other phenomena an impact that doesn't concern them, which would create obstacles to knowledge.
I think there are conclusions to be drawn from the fact that half of the 30 most expensive municipalities include 11 municipalities in the Algarve, 2 in the Alentejo, 1 in Madeira, and another whose best-known images are of surfers and giant waves (the days of black and white portraits of fishermen and ladies fishmongers on Nazaré beach are long gone).
This goes without mentioning the obvious: there is undeniable foreign demand in the other 15 most expensive municipalities (13 in the LMA and 2 in the PMA). In fact, Statistics Portugal itself points out that "In Grande Lisboa and Área Metropolitana do Porto, the median price (€/m2) of transactions carried out by purchasers with tax residence abroad exceeded the price of transactions by purchasers with tax residence in the national territory by 82.3% and 47.5%, respectively".
Researchers widely accept that using tax residence in Portugal to determine the number of foreign buyers is insufficient. Non-habitual residents, the overwhelming majority of whom are foreigners and necessarily domiciled in Portugal, are just one of the evidence indicators of this underestimation.

Graph 10 - Evolution in the median price per square meter for residential property transactions in the 20 municipalities with the highest prices in Portugal between Q1 2018 and Q1 2026 [blue columns represent increases of up to 100%, yellow columns represent increases of more than 100% and up to 150%, orange columns represent increases of more than 150% and up to 200%, and red columns represent increases of more than 200%].
Source: Statistics Portugal.
CONCLUSIONS
(and what the statistics don't tell us)
This article aims to share the dynamics of house prices over the last 6 years and identify the variables responsible for their trajectories in different parts of the country.
That said, the figures presented throughout this article leave little doubt: house prices have risen significantly in different regions since 2018. Previous studies suggest that this trend has been going on since mid-2015.
SPECULATION OR REHABILITATION?
In the context of urban rehabilitation, purchasing a vacant building at time X will predictably lead to the sale of "new" apartments at a much higher value/ sqm at time Y, through the incorporation of value from the development of the project and the respective work.
In other words, the price variations we have seen in this article should not be understood strictly as a "natural appreciation" of housing prices.
The result of intervention in the building incorporates value. The end product is often a different apartment in a different building. Hopefully, in a street that has also become a different place through the repetition of this pattern.
It is this pattern that should be present in more visible increases in house prices. When this is the case, most of the built heritage in a given place becomes an upgrade on what it was before. This probably invites a perception of change: the feeling that the place is nicer today than it was yesterday but still not as nice as it could be tomorrow.

Detail of buildings in Largo do Toural, in the historical center of Guimarães.
By Bruno Martins.
This is something we have seen, not just in Lisbon and Porto, but in many other medium-sized cities with historic areas, or rather, in residential areas where, as a general rule, there are centuries-old buildings.
It may sound vague, but appreciating what is perceived at a given moment as “old” is very present. And one thing is sure: I receive a lot of briefings from foreign buyers that begin or end with the expression “house with character”.
Let's go back to the historic centers of Lisbon and Porto. As mentioned in the introduction to this article, according to INE, property rehabilitation will account for 22% of all work completed in Portugal between 2018 and 2023 and 31% in the five years immediately prior. I wouldn't be surprised if, in the rehabilitation areas of Porto, the weight of urban rehabilitation was double. At the end of 2022, Confidencial Imobiliário (the best-known real estate database in Portugal) reported more than 30% growth in investment in urban rehabilitation areas in Porto.
I want to point out that when we see that prices in Campanhã have tripled in the space of six years, we should consider that this appreciation could also be the result of the repetition of this pattern: decrepit apartments, buildings, and streets rehabilitated to today's standards.
WHEN STATISTICS AREN'T ENOUGH...
In 2023, I began to hear Afonso Silva, Operating Principal at KW LEAD and author of a monthly event called “Barómetro de Mercado” (Market Barometer), comment that prices in Lisbon might not be rising. He suggested that the median/sqm of sales (the central value, the one that divides a set of data in half and which is used by INE) wasn't replicating the evolution of house prices in the capital in the best way.
Earlier this year, I read a short text by Joaquim Montezuma, Professor at ISEG and PhD in Real Estate Economics from the University of Glasgow, in which he shared a similar idea.
As far as I could tell from the conversations I had with both of them, neither seemed convinced by the rise in prices, considering the significant decrease in demand (determined by the number of transactions), and a slight increase in supply (measured by the availability of new dwellings).
Remember when I said that Cascais was surprising for having both such a high price/sqm and such a sharp increase in value over the last 6 years?
In other words, that the median value/ sqm of transaction values had doubled in the space of 6 years?
It occurred to me that I could go to Idealista and analyze the supply of houses on the market. I found that, as of today, July 30, 2024:
1) Of the 1,050 residential properties that Idealista advertises for €3,000,000 or more throughout the Lisbon District (which comprises 16 municipalities, including Lisbon and Cascais), 595 (57%) are in the municipality of Cascais. Lisbon has 236 advertisements for dwellings in this price segment, equivalent to 40% of those in Cascais.
2) On the other hand, these 595 homes (worth €3,000,000 or more in Cascais) represent 11% of all the houses advertised by that real estate portal in that municipality. While the 236 properties advertised in Lisbon for €3,000,000 or more represent just 2% of the total number of homes advertised on that portal in the capital.
Are these figures high? Yes. And honestly, it seems surprising to me that 11% of the listings for houses for sale in Cascais have values equal to or greater than €3,000,000. Even though we know that the annual weight of transactions for properties of this value may be lower, if only because, traditionally, sales times are longer.
If and when they are sold, the transaction values of these houses will necessarily inflate the median and average value/sqm of the universe of dwellings sold in Cascais. Not only do these sales tell us very little about the evolution of house prices in other market segments, but they also don't suggest that the value of those other properties has doubled in six years.
Could it be that, as Joaquim Montezuma said, “the increase in prices is caused by a greater weight in the sample of more expensive properties”?
I would venture to answer yes.
Let's go back to Afonso Silva and an interesting example he has used to illustrate the idea that transaction values in Lisbon will not continue to rise, at least not at the rate that the median prices/sqm suggest.

Aerial view of a beach in the Algarve.
By Radu Bercan.

A cell in the former Robben Island Prison in South Africa, where Nelson Mandela spent most of his nearly 30 years in captivity.
By Tasneem Jhetam.
AUTHOR'S NOTE
When someone is considering buying/selling a residential property, it's common to base their expectations on the values they will spend/make on the content of articles like this one. However broad, deep, analytical, and critical a text may be, it is a mistake to value reflections like this beyond a simple contextualization.
Do you have extra reasons to read this article if you are considering buying/selling a property? Absolutely. However, this text's effort is not enough to assess the market value of a given home, nor is its purpose.
When someone is thinking of buying an apartment in Matosinhos, a villa in Belém, or a dwelling in any of the other places mentioned in this article, they need to understand (or at least try to) what is happening right there.
Each neighborhood has its unique characteristics and trends. Understanding these nuances is crucial in making well-informed decisions.

View of the town of Óbidos from the castle walls.
By Kite_rin.
BRIEF METHODOLOGICAL NOTE
All the data shared in this article was sourced from the local "House Prices Statistics at local level" of the Statistics Portugal, which has three methodological advantages over any other housing price report in Portugal:
1) They refer to the actual transaction values and the Gross Private Area that appears on the property's Tax Authority Property description (thus ensuring consistent information on prices per square meter), information that is only possible thanks to the existing protocol with the Tax and Customs Authority (AT), which gives Statistics Portugal access to tax information;
2) They include all property transactions in Portugal for “housing”, with a gross private area of more than 20 sqm;
3) The results published for each quarter correspond to the arithmetic average of the value recorded in that quarter and the three previous quarters, significantly mitigating any seasonal effects on sales behavior.
Bank Appraisals on Housing
Statistics Portugal also produces a monthly study on bank appraisals. But this is only “information characterizing the dwellings that are the subject of an application for bank financing and in the process of which there is a technical evaluation of each property”, which includes 7 banking institutions and which Statistics Portugal presumes to cover about 90% of the total amount of new housing loans granted in Portugal. In other words, this data only represents a portion of the universe of transactions.
Not to mention that, in my opinion, many of these reports are done in such a short space of time that their quality is significantly affected.
Studies produced by portals, brokers and databases
It should also be noted that when we are dealing with a study carried out by a real estate portal, the results are based on the asking price (which, in the vast majority of cases, does not correspond to the actual transaction value). It is also more difficult to ensure that the areas entered are correct. What's more, we often find the same property advertised on the same portal for different prices and area values.
On the other hand, if the study was carried out by a real estate brokerage brand, it will be able to present real transaction values (and more information and details about those particular properties), but only those in which it had direct involvement, which will significantly limit the scope of the study.
There are also databases (the best-known is Confidencial Imobiliário) that have access to the transaction values that the affiliated brokerage companies communicate to them. But in any case, they ignore all transactions carried out by private individuals or brokerage companies with which they do not have agreements (the point in favor of this database is that it produces results more quickly).
For these reasons, I believe that Statistics Portugal's local housing price statistics are the ones that offer the most exhaustive and representative picture of the entire universe of housing prices in Portugal.